Booster: Performance Bottleneck Detection
For any app, jank rate and ANR rate are two critical metrics for measuring quality. There are already many mature APM tools and platforms for tracking runtime performance, but for products practicing agile development, the cycle from development to canary release to full rollout is a long one. By the time you collect jank and ANR reports and ship fixes, you have to go through the canary-to-full-rollout cycle all over again.
If we could catch performance issues in code before release, product iteration speed would improve dramatically. Generally speaking, there are a few approaches:
- Code review
- Code scanning
- Static analysis
Booster chose static analysis because the first two approaches cannot handle cases where you have no access to the source code.
Performance Measurement
Android officially provides many profiling tools. While powerful, they all require too much manual intervention and have a high barrier to entry:
-
Enabling Method Tracing requires adding these two lines around the code you want to measure:
1
2
3Debug.startMethodTracing("booster")
// ...
Debug.stopMethodTracing()Moreover, Method Tracing severely degrades runtime performance. If the measurement scope is too broad, the lag becomes unbearable.
-
Enabling systrace requires starting adb, connecting to a device in debug mode, and adding these two lines around the code:
1
2
3Trace.beginSection("Activity.onCreate()")
// ...
Trace.endSection()Although the performance overhead is much lower than Method Tracing, the measurement scope is limited by the buffer size, so you can only measure a single code section.
-
Android Studio 3.0 introduced the powerful Android Profiler for locating and analyzing issues, but only code branches covered during debugging can be detected, and the scope is limited.
-
The Jetpack Benchmark Library allows measuring code performance through unit tests. For products with rapid iteration cycles, this is practically a non-starter.
To quickly discover potential performance issues across the entire codebase before release, we proposed using static analysis to detect performance bottlenecks in code.
How to Identify Performance Bottlenecks?
The Main Thread
For an app, the root cause of ANR and jank is the main thread being blocked. In any event-loop-based system, any method call that blocks the main thread can be considered a performance bottleneck. Beyond that, there are other factors affecting runtime performance and stability, such as thread overload, use of finalizers, and so on.
The key to static-analysis-based performance bottleneck detection is determining whether a method runs on the main thread. In virtually all event-loop-based GUI systems, UI operations happen on the main/UI thread, which means:
- If we can find method calls related to UI, we can assume the method runs on the main thread.
- If any method in a call chain runs on the main thread, the entire chain can be considered as running on the main thread.
Main Thread Entry Points
After analysis, we settled on the following rules:
Call chains starting from Application template methods. See: Application Entry Points
Call chains starting from Activity template methods. See: Activity Entry Points
Call chains starting from Service template methods. See: Service Entry Points
Call chains starting from BroadcastReceiver template methods. See: Receiver Entry Points
Call chains starting from ContentProvider template methods. See: Provider Entry Points
Call chains starting from methods whose parameter list or return type includes the following types:
- Fragment
- Dialog
- View
- Widget
- Layout
The
run()method ofRunnablesubmitted via the Main Handler
While these rules may not cover every main thread entry point, they address at least 80% of cases. Since every app's architecture is different, achieving greater precision would require app-specific extensions to Booster.
Method Call Chains
With the analysis above, we can isolate all call chains running on the main thread from the overall Call Graph. But how do we determine which of those chains have performance bottlenecks?
After extensive statistical analysis, we compiled a list of methods that block the main thread. Due to space constraints, only a subset of APIs is listed here. For the full list, see: LINT_APIS:
1 | "java/lang/Object.wait()V", |
Based on the conclusions above, we can match the API list against all call chains running on the main thread to identify the ones with performance bottlenecks.
Summary
For performance bottleneck detection, the primary task is constructing a Call Graph. The Lint Transformer proceeds as follows:
- Parse AndroidManifest.xml to obtain the class names of the Application and the four major components.
- Create a Global Call Graph and a Lint Call Graph, using a ROOT node as the parent of all main thread entry methods, making it easy to later isolate main thread call chains. The Global Call Graph structure looks like this:
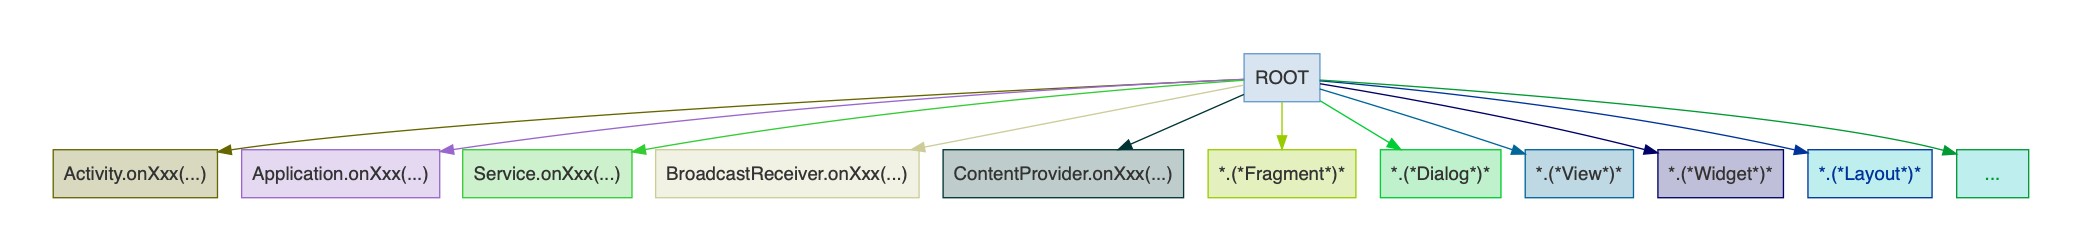
- Parse all class files, extract invoke instructions from method body instruction sequences, build Edges, and add them to the Call Graph.
- Starting from the first-level children of the ROOT node, traverse the entire Call Graph to match against the method list defined earlier. If a match is found, add that chain to the Lint Call Graph.
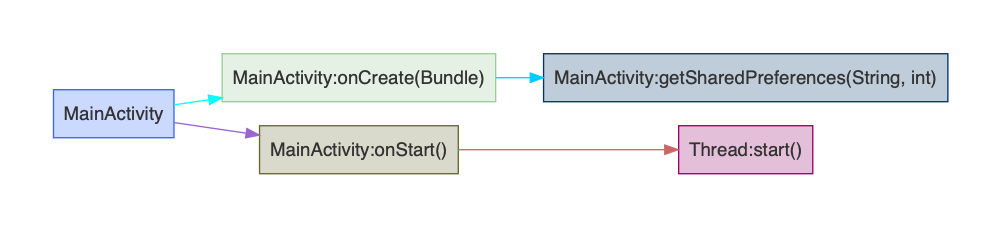
- Finally, split the Lint Call Graph into smaller graphs by entry class, generating reports in dot format. After converting to PNG, the result looks like this:
- Blog Link: https://johnsonlee.io/2019/06/05/booster-transform-lint.en/
- Copyright Declaration: 著作权归作者所有。商业转载请联系作者获得授权,非商业转载请注明出处。