Why Is OpenAI Always Short on Compute?
OpenAI had just 0.2 GW of available compute in 2023. That rose to 0.6 GW in 2024 and about 1.9 GW in 2025. Compute increased 9.5 times in two years and still was not enough. In April 2026, OpenAI raised the target again: 30 GW by 2030.
Thirty gigawatts is nearly sixteen times OpenAI's available compute in 2025. Four months after announcing that target, OpenAI signed PORTS-Pike, an AI data center planned for roughly 8 IT-GW.
How many data centers has OpenAI already signed? Why does it keep signing more? And how large is 8 GW inside a 30 GW plan?
How many data centers has OpenAI actually signed?
Start in 2023. The first large contract came from Microsoft. That multi-year partnership disclosed neither gigawatts nor the locations of individual Azure supercomputers. It only said the two companies had built multiple systems used to train all of OpenAI's models.
The 0.2 GW, 0.6 GW, and 1.9 GW figures therefore describe OpenAI's available compute by year. They are not a site inventory that can be pinned to a map. OpenAI has not disclosed how much Azure, OCI, CoreWeave, or AWS contributes, or how many gigawatts sit in each operating data center.
Abilene is the first campus where location, capacity, and operating status can all be pinned down. Construction began in 2024, and AI workloads were running in less than a year. By mid-2026, 42% of its planned 1.2 GW had been delivered to the customer; the rest remained under construction.
Only then did physical campuses begin to appear one by one. In September 2025, Abilene plus five new sites brought Stargate to six campuses and nearly 7 GW of planned capacity. Michigan became the seventh campus one month later. Georgia's Project Camellia and Ohio's PORTS-Pike followed in 2026.
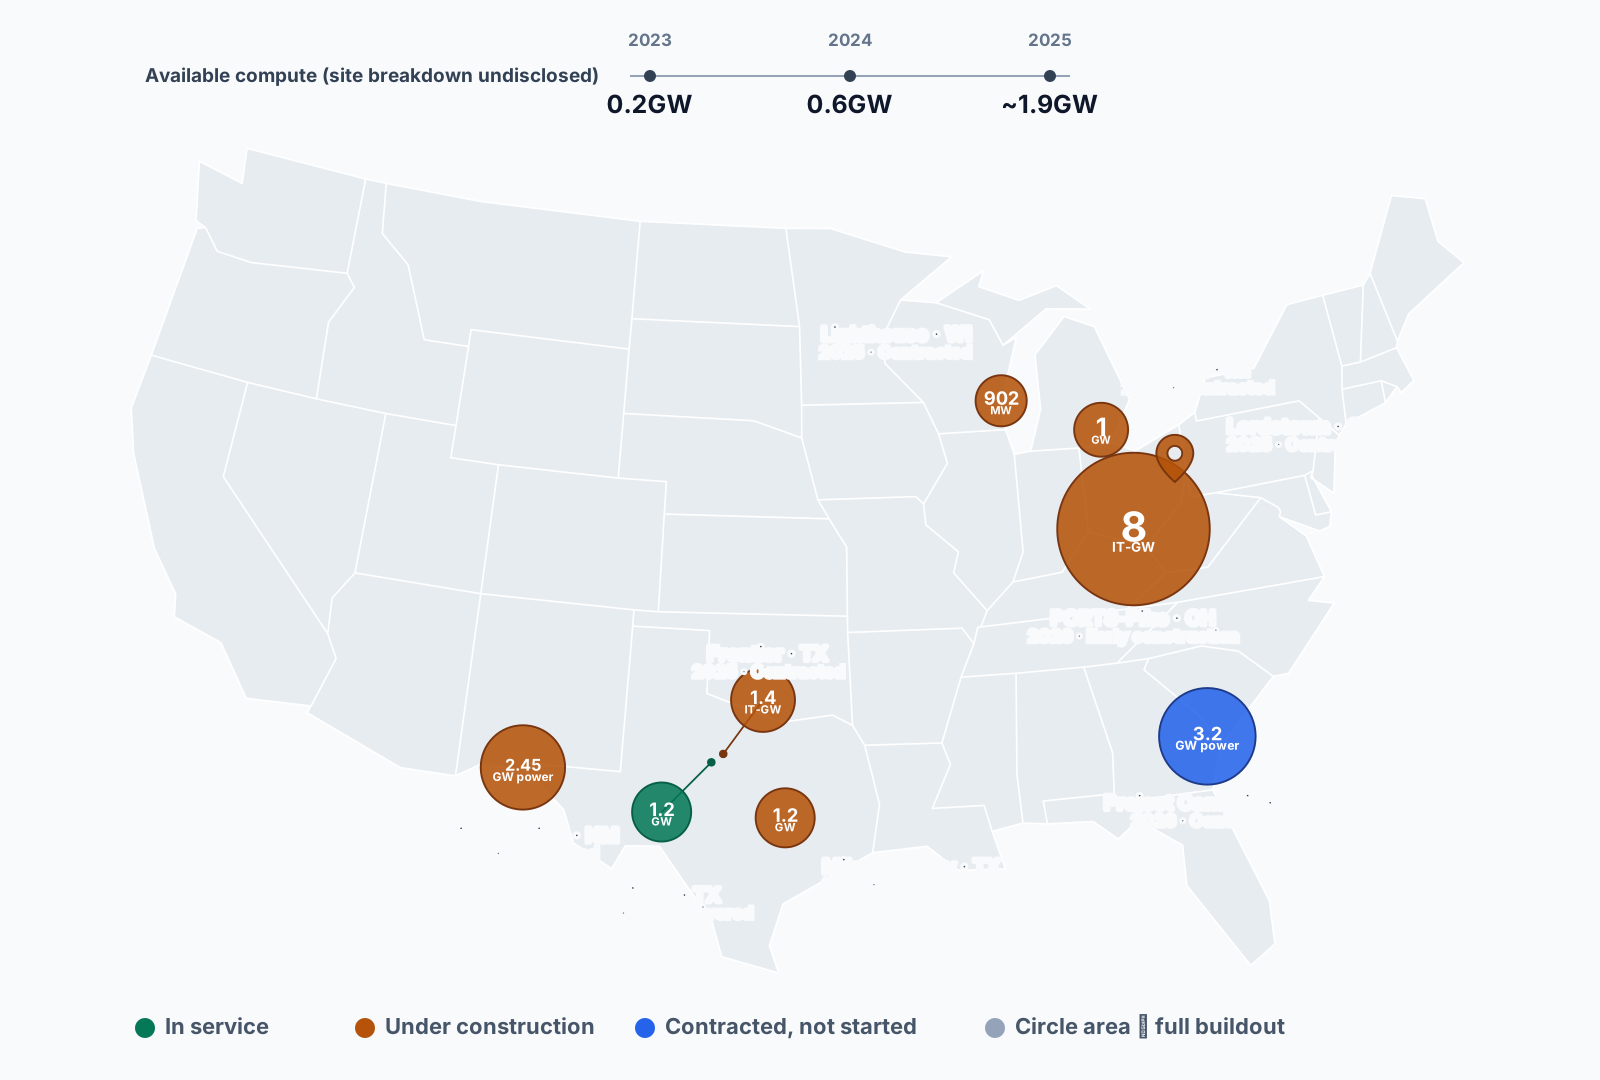
As of August 22, 2026, Abilene was the only one of the nine campuses already running workloads. Seven others had entered construction. Camellia was still in permitting and had not broken ground. SB Energy had begun developing PORTS-Pike before OpenAI signed on in 2026, and the developer already classified it as In Early Construction. Circle area scales with each site's disclosed full buildout, not gigawatts available today. Abilene's green circle means the campus is in service; only 42% had actually been delivered.
The disclosed gigawatt figures also use different denominators. PORTS-Pike reports IT capacity, Shackelford reports critical IT load, Project Jupiter reports installed fuel-cell capacity, Lighthouse reports campus development, and Doña Ana and Camellia report power capacity. They show the relative size of each buildout, but they cannot be added directly.
The map answers where these nine campuses are and how far each has progressed. It still cannot tell us how many gigawatts OpenAI has secured in total.
The same compute can reappear across four layers of disclosure: sites, cloud capacity, compute systems, and chips. Oracle's 4.5 GW partnership will land across multiple campuses. Milam County's 1.2 GW lease was already included among the five sites announced in 2025. NVIDIA's 10 GW remains a letter of intent, while Broadcom's 10 GW is a system deployment term sheet. The latter two total 20 GW of systems intended for OpenAI and partner data centers. They are not another 20 GW of new buildings.
Microsoft, Oracle, AWS, CoreWeave, and Google Cloud provide cloud capacity that may sit on the same physical infrastructure. Adding every gigawatt from every press release can count one data center twice or even three times.
That is why the map includes only physical campuses whose location and delivery status can be pinned down. This leaves two capacity boundaries that do not double-count: 1.9 GW available in 2025 and the 30 GW OpenAI plans to have in 2030.
Where did Anthropic's gigawatts go?
Anthropic looks quiet by comparison. Claude's users and revenue are growing too, so why do we rarely see Anthropic announcing one 5 GW or 8 GW data center after another?
The two companies acquire compute differently. OpenAI brought physical infrastructure under Stargate, so its name stays attached to a campus from site selection through construction. Anthropic spreads compute across AWS Trainium, Google TPU, Azure NVIDIA, Fluidstack, and SpaceX. The cloud provider, chip supplier, or data center developer usually publishes the announcement.
The gigawatts did not disappear. In October 2025, Google arranged more than 1 GW of TPU capacity for Anthropic to come online in 2026. In April 2026, AWS signed for up to 5 GW, with nearly 1 GW expected online by the end of 2026. One month later, Anthropic took all of Colossus 1's capacity, more than 300 MW. Add 1 GW from Azure and Google/Broadcom capacity beginning delivery in 2027, and Anthropic is also locking in years of gigawatt supply. It simply does not package that supply as one Stargate campus map.
The comparison stalls at available compute. As of August 22, 2026, the latest company-level figures on a comparable basis still ended in 2025. OpenAI disclosed 1.9 GW; Anthropic disclosed no total. An OpenAI memo estimated Anthropic at about 1.4 GW. After Epoch AI incorporated that external anchor into its model, its 90% interval ran from 1.0 GW to 1.9 GW, with a 1.38 GW median. Every Anthropic value in the chart is therefore marked as an estimate. It cannot be treated like OpenAI's disclosed number.
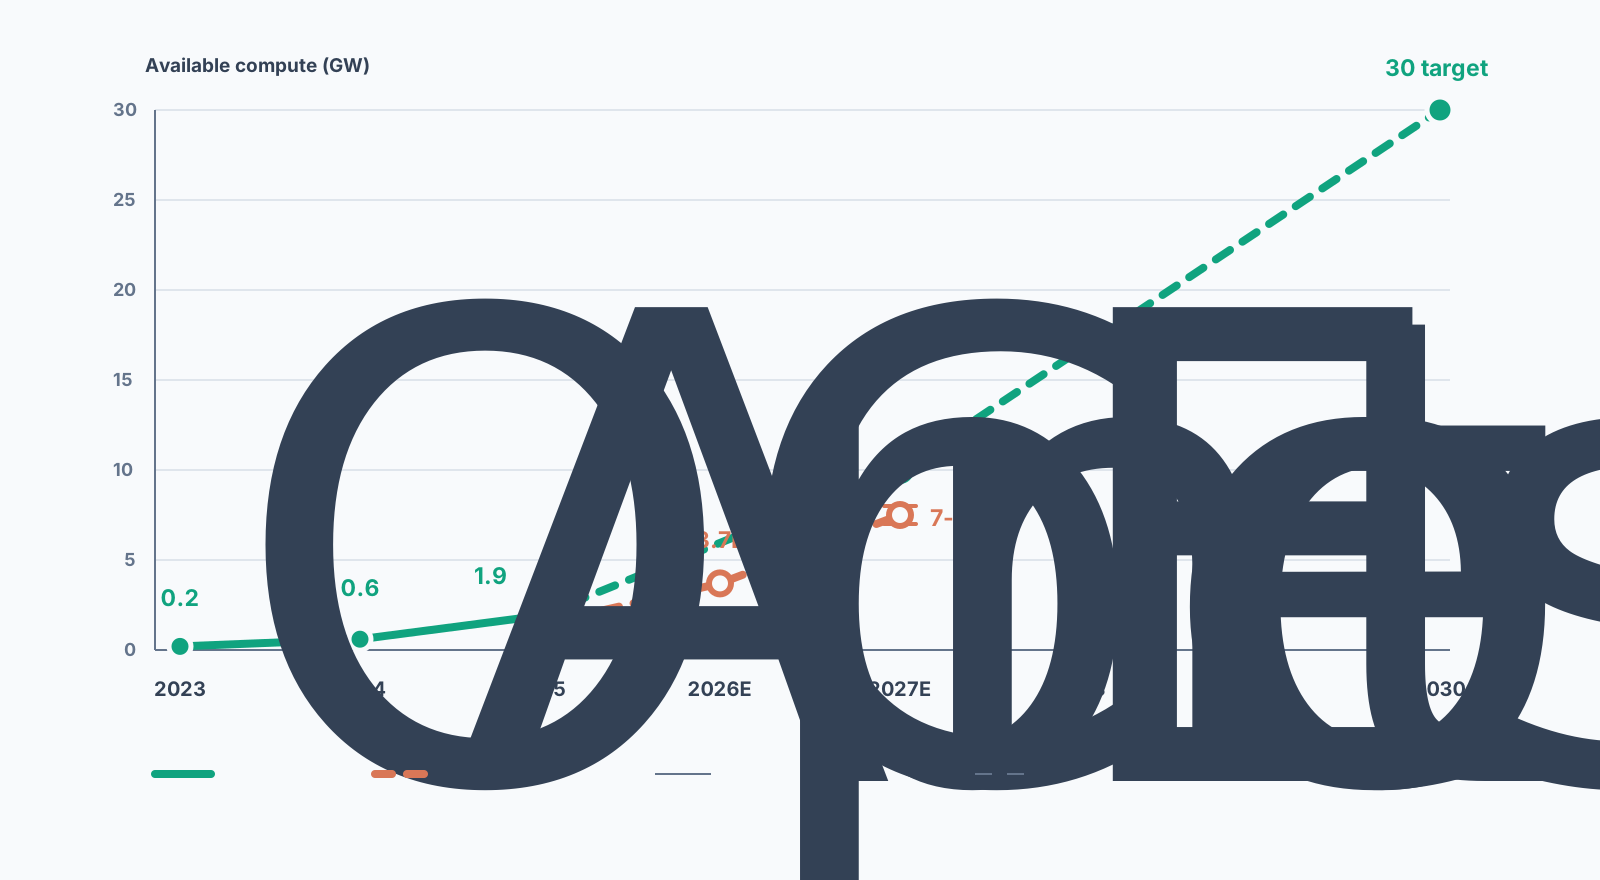
The 2026 figure can only be estimated too. Add the AWS, Google, and SpaceX capacity announced for 2026 to the 1.4 GW estimate for 2025, and year-end points toward roughly 3.7 GW. That is not Anthropic guidance. Delivery delays or overlapping capacity definitions could change it.
Beyond 2026, OpenAI's memo provides only two ranges: OpenAI expects to enter the low-double-digit gigawatts in 2027, while Anthropic is estimated to reach 7 GW to 8 GW by year-end. OpenAI separately targets 30 GW in 2030. Anthropic has published no company-level available-compute guidance for 2028 through 2030, so the orange line stops in 2027. OpenAI's green dashed line merely connects the 2027 and 2030 anchors; it is not annual guidance. Spreading AWS's maximum 5 GW, Google's 5 GW, and Azure's 1 GW across future years would disguise contract ceilings as a delivery schedule.
Anthropic rarely appears in headlines about giant data centers, yet it is competing for the same gigawatts. OpenAI made the delivery path visible. Anthropic split that path across multiple infrastructure suppliers. Both curves are moving from less than 2 GW toward the 10 GW range.
What kind of demand needs 30 GW?
The acquisition paths differ, but new capacity ultimately has to be consumed by workloads. OpenAI's 30 GW has to feed two kinds of demand at once.
Training compute buys the capability of the next model; inference compute delivers today's product. More users and more requests increase inference demand. Reasoning models spend more test-time compute on each request. With Agents, one request can unfold into model invocations, tool calls, and retries that continue for minutes or even hours.
OpenAI put three years of data side by side. Available compute grew 9.5 times. ARR rose from $2 billion to more than $20 billion, almost exactly tenfold. OpenAI's conclusion was direct: with more compute, product adoption and revenue would have grown faster. Compute trains future models and carries today's revenue at the same time.
Better models drive more usage. More usage drives more revenue. Revenue secures the next block of compute. Algorithms and hardware will keep improving performance per watt, but the demand unit is also changing from one answer into a task that runs continuously. New workloads quickly consume the capacity released by efficiency gains.
Thirty gigawatts still sits on a roadmap. Every new agreement OpenAI signs locks in supply years ahead.
How large is PORTS-Pike's 8 GW?
The PORTS-Pike announcement gave no GPU count and no FLOPS figure. It gave one number: 8 IT-GW. That measures the power capacity available to servers, networking, and storage. It does not tell us how much compute the cluster can produce.
Inside OpenAI's compute footprint, 8 GW equals roughly 4.2 times all of its available compute in 2025 and 27% of its 30 GW target for 2030. One campus accounting for more than a quarter of the long-term target is large by any measure.
But the 8 GW will not arrive at once. The first 800 MW, or 0.8 GW, is expected to become available in 2028. The full buildout runs for six years, through 2032. OpenAI will not start paying for all 8 GW today either. Lease payments begin as completed capacity becomes deliverable.
The same 8 GW therefore occupies three positions at once. It is PORTS-Pike's final planned capacity, one possible contribution to the 2030 target, and a buildout that may not finish until 2032. Counting it as available compute today has no basis. Even assigning the full 8 GW to the first delivery milestone in 2028 would overstate 800 MW by a factor of ten.
The question changes from "How many more gigawatts does OpenAI need?" to "When do the gigawatts already under contract become available compute?"
Data Center is still a black box
The 8 GW under agreement becomes available compute only after the entire delivery chain of site, power, facility, and cluster is complete.
Replication Speed Is the Real Bottleneck tracked that exact time gap: how quickly OpenAI's demand for 30 GW forms, and how long capacity capable of carrying production workloads takes to replicate. Demand forms quickly while supply expands slowly. Orders, price increases, and excess returns accumulate inside that Replication Gap.Follow the Replication Gap downstream and AI's bottleneck lands on Data Center. SpaceX takes the more aggressive path: replace the entire ground deployment chain. But Data Center is still one box in the Bottleneck Migration Network.
The grid, transformers, switchgear, UPS systems, liquid cooling, GPUs, HBM, switches, optical transceivers, SSDs, construction, and commissioning are all compressed into that box. Every company can pick one term and call itself an AI infrastructure beneficiary. Knowing that "data centers are constrained" does not tell us who merely benefits from demand and who controls the binding constraint.
With so many data centers already operating, why can't OpenAI install GPUs in existing data halls or expand an existing campus? Why wait until 2028?
Why existing data centers struggle with AI superclusters
Traditional and AI data centers can look similar at the campus level, with data halls, substations, and cooling plants. Whether those systems can be reused depends on the workloads they were designed to support.
Most enterprise and cloud workloads can be divided into relatively independent requests, VMs, or containers. When one server goes offline, the system usually loses a fraction of capacity. Power, cooling, and networking act as shared infrastructure around rows of servers that can operate independently.
Large-model training and increasingly large inference workloads can put thousands or tens of thousands of GPUs into one job. Scale-up fabrics create a larger compute domain inside the rack; scale-out fabrics synchronize racks. A bandwidth shortfall, packet-loss problem, or unhealthy node can slow the entire job. The network becomes a compute backplane, storage must continuously feed training data and absorb checkpoints, and power and thermal systems must sustain rows of high-density racks at the same time.
Density writes this change into the physical plant. In the Uptime Institute Global Data Center Survey 2025, the most common deployed rack density remains 4–5 kW. The NVIDIA DSX reference design places AI cabinet TDP at 198–330 kW. The first number describes the installed base; the second describes a leading-edge rack design, so they cannot be divided into a growth rate. The distance between those orders of magnitude is still enough to redraw power distribution, thermal management, and commissioning.
Existing facilities can absorb some workloads directly, and retrofits can release additional capacity. At supercluster scale, floor space is often the easiest part to reuse. The hard limit is how much power, cooling, networking, and storage capacity remains available at the same time. If any one system falls short, it has to be expanded, retrofitted, and recommissioned. Expanding an existing campus does not bypass that delivery chain. OpenAI is waiting until 2028 for all of those systems to reach a deliverable state together.
The delivery unit in an AI Data Center therefore expands from an independently operable server to a fully validated healthy cluster. Installing the GPUs completes only one intermediate step.
Installed GPUs can still yield zero compute
Data center supply follows AND logic: every subsystem has to be available at the same time.
GPUs arrive while the site remains unenergized: available compute is zero. The site is energized but the cooling system has not completed integrated commissioning: capacity is still unavailable. The facility finishes construction and testing and reaches Ready for Service (RFS), meaning it can be delivered under the contract, but the GPU cluster's firmware, networking, storage, and software stack have not passed validation: the cluster still cannot carry production workloads.
Equipment entering a warehouse adds inventory. Available compute increases only after the system passes validation and handoff.
RFS is the easiest boundary to miscount. A facility moves from Site Selection through permitting, design, procurement, construction, energization, and commissioning before reaching it. Public colocation contracts generally define this state as a facility completed and tested according to the agreement and ready for delivery. It does not mean the GPU cluster has entered production. Both GDS's project documentation and a public colocation agreement place commissioning before formal delivery.
After RFS come IT deployment, burn-in, fabric validation, cluster acceptance, and Production Handoff. NVIDIA separates Delivered, Healthy, Reserved, and Active/In-Use as well. Equipment handed to the customer, equipment meeting its health criteria, capacity reserved, and capacity actively serving workloads are four different states. NVIDIA AI Cloud Requirements makes those boundaries explicit.
Data center research therefore cannot stop at GPU shipments or place every announced gigawatt in one table. The handoff a project has reached determines whether that supply can be counted.
Put GW back on a coordinate system
Breaking down PORTS-Pike requires two axes.
The horizontal axis asks: How far has the project progressed? A project at Site Selection, energization, RFS, or Production Handoff can carry the same 1 GW label while sitting at a completely different distance from available compute.
The vertical axis asks: Which system has not been delivered? Power, thermal, compute, networking, and storage must all be available. One missing layer prevents the preceding gigawatts from becoming production capacity. NVIDIA's DSX reference architecture also separates an AI factory into facilities, compute, networking, storage, and operations.
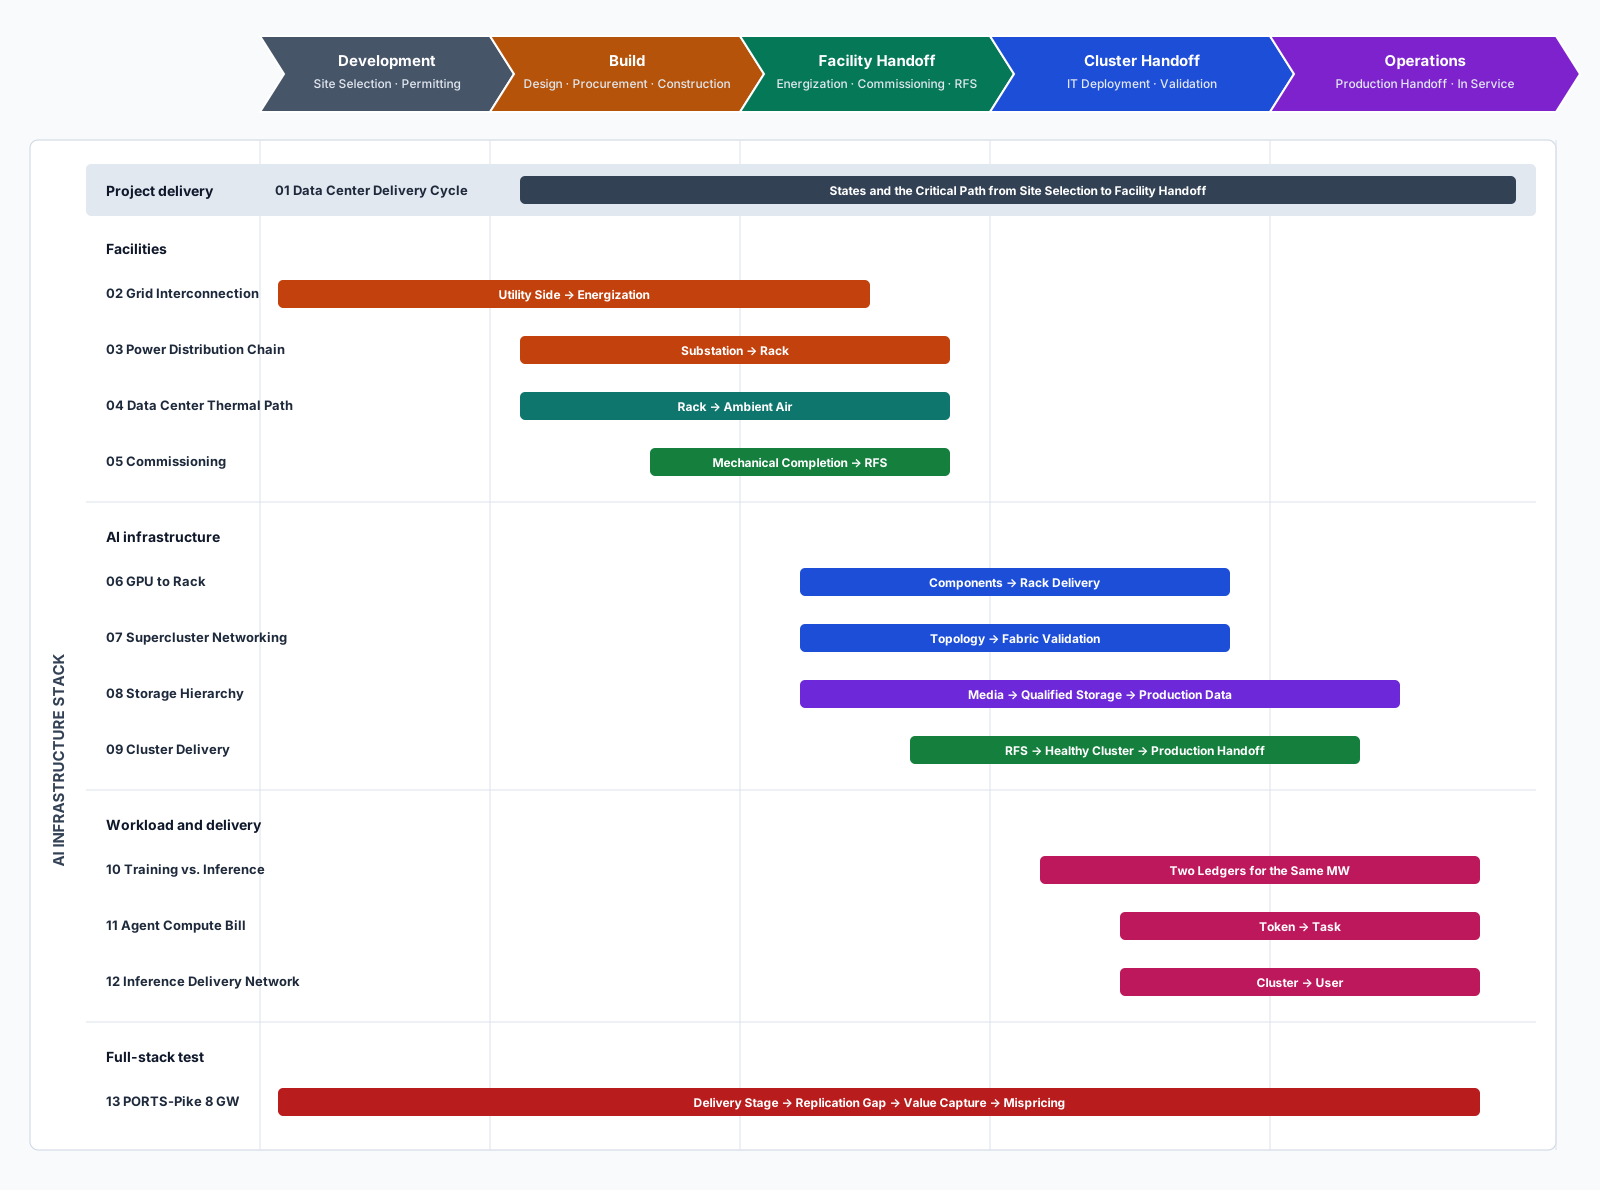
Once the axes intersect, the number gains coordinates. An announced 1 GW is target capacity. An energized 1 GW can receive power. One gigawatt at RFS is a deliverable facility. A 1 GW cluster at Production Handoff can carry production workloads. All four say 1 GW. They are not the same supply.
Only after identifying which 1 GW we are looking at can pricing and returns enter the analysis.
The coordinate system is still abstract. Power, thermal, compute, networking, and storage now have positions, but Data Center itself still has no shape.
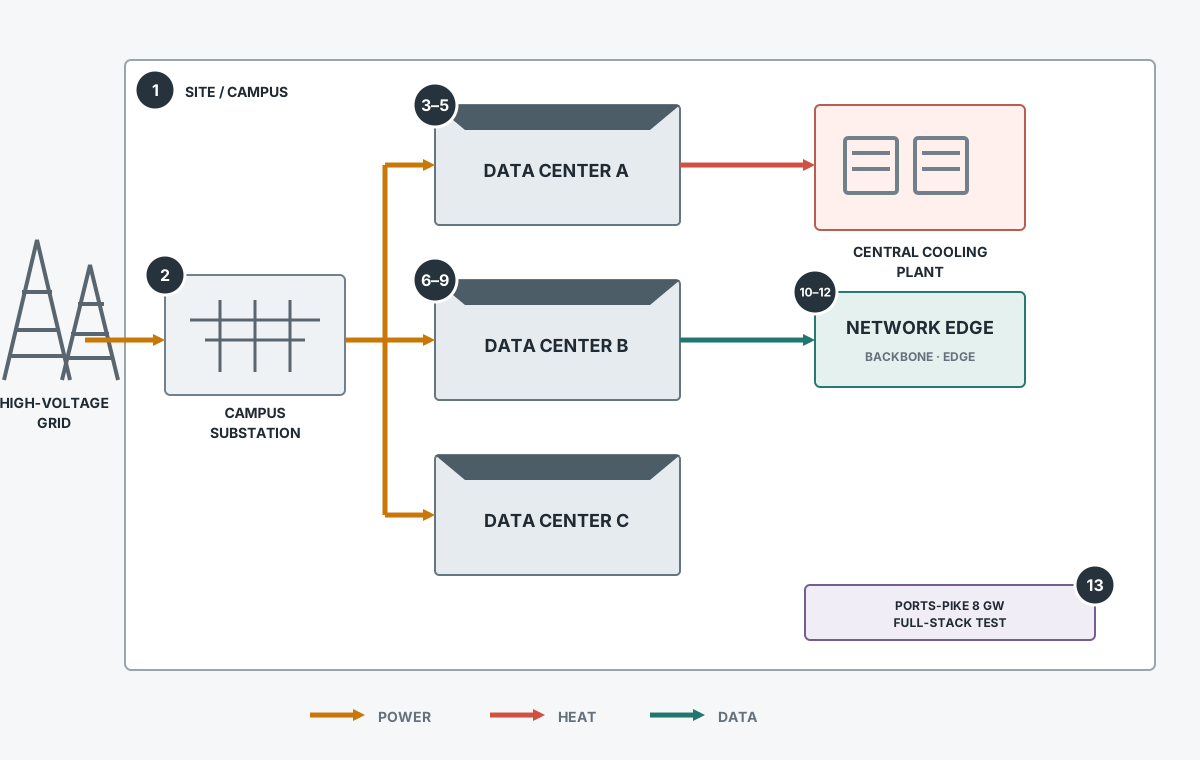
To give it shape, start at the campus layer. A gigawatt-scale site is not one large building filled with GPUs. It is a campus substation, repeated data center buildings, central cooling plants, roads, utility corridors, and network exits. Power enters from the high-voltage grid, several buildings share campus infrastructure, and data leaves through the network edge.
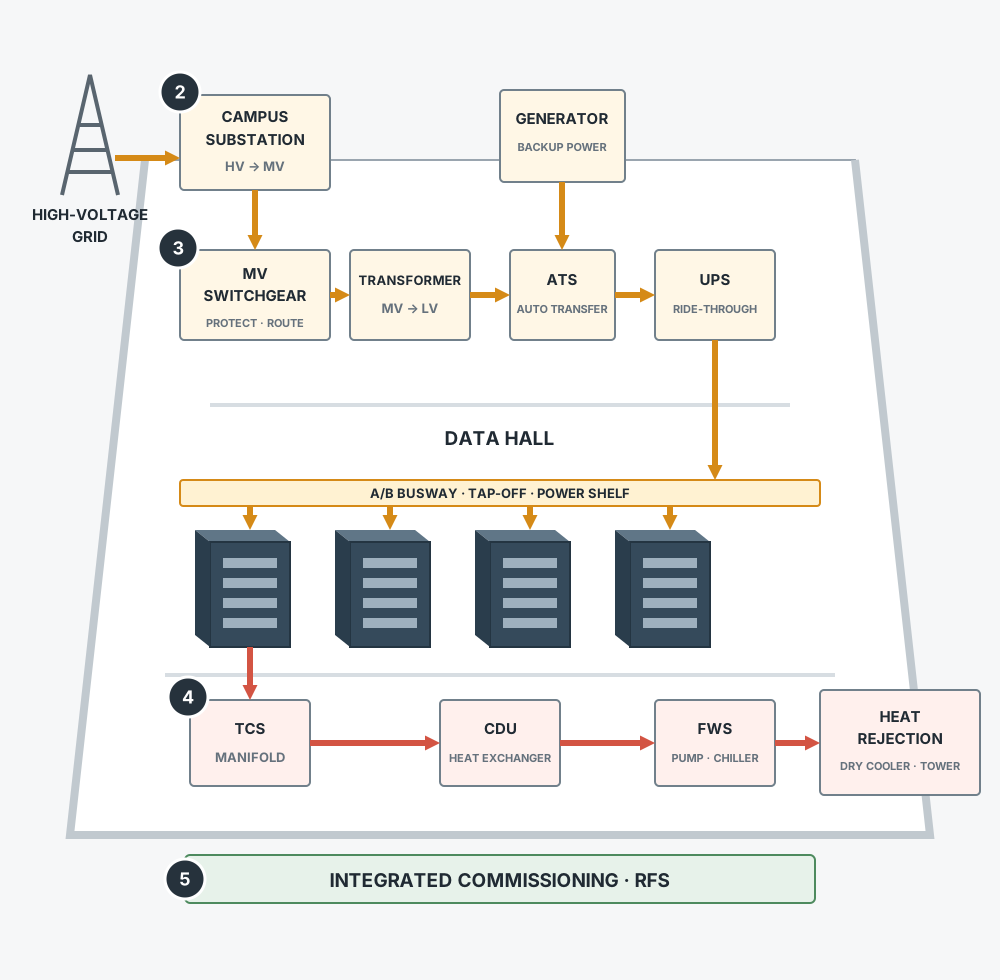
Inside each facility, voltage steps down from the campus substation and passes through switchgear, ATS, UPS systems, and busways before reaching the racks. Rack heat returns outdoors through TCS, CDUs, and FWS. Both physical paths must pass integrated commissioning before the facility reaches RFS.
RFS still delivers only the facility. IT deployment at the rack level comes next: GPUs, CPUs, HBM, NICs, and DPUs first form compute trays, then connect through scale-up and scale-out fabrics into a cluster, attach to storage, pass validation and cluster acceptance, and finally cross Production Handoff. Training, Inference, and Agent workloads start here; results then cross backbone and edge networks to reach users.
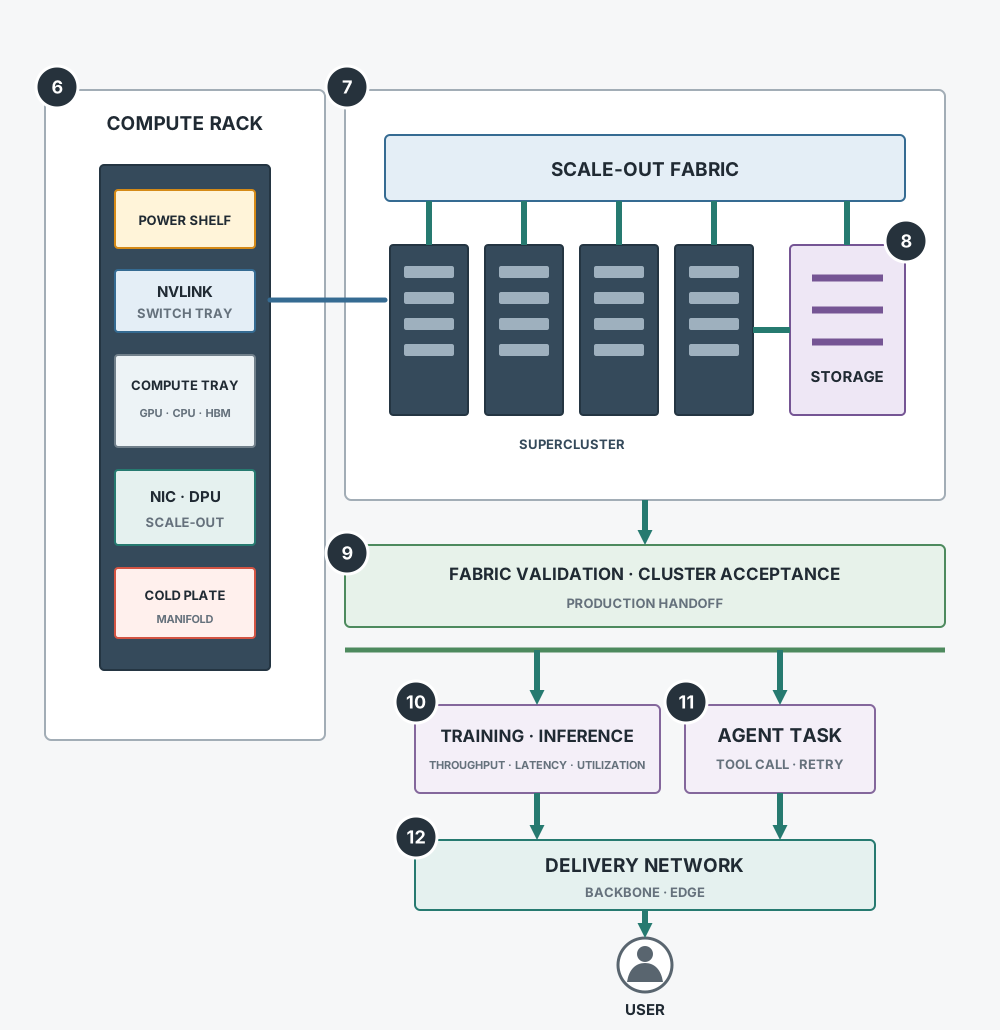
The three diagrams show the campus, facility, and cluster layers of one delivery chain. The outline below follows the same route. The order is fixed: first move through the project delivery lifecycle from Site Selection through power, thermal, and commissioning to RFS. Once the facility is deliverable, assemble compute, networking, and storage into a healthy cluster. After Production Handoff, follow workloads and delivery networks until physical capacity becomes billable service. Finally, put the whole chain back into PORTS-Pike's 8 GW and test which Replication Gap lasts longest and which supplier can turn it into revenue and cash flow.
The chain does not fit into one essay. Grid interconnection, power distribution, thermal management, cluster networking, storage, and workloads are each deep enough for a proper investigation. Forcing them together would collapse Data Center back into the box we just opened.
The series will therefore move through the chain one layer at a time. The titles below mark the route; links will appear as each essay is published.
First ask how far the data center has been built
OpenAI announces another 1 GW, 5 GW, or 8 GW. How far has that capacity actually progressed? Contracted, under construction, energized, and deliverable sit behind very different gates.
Data Center Delivery Cycle: Site Selection to Facility Handoff
Announced, planned, under-construction, energized, and RFS capacity belong on one timeline. The current state, the next gate, and the slowest gate determine when supply can be counted. Once those states are separated, the phrase "has power" becomes suspicious. What exactly has the project secured?
Grid Interconnection: The Data Center's First Gate
A claim that a data center "has power" may mean a signed PPA, an interconnection agreement, or electricity physically reaching the site. Those states can be years apart. Even after power reaches the site, why can the GPUs still not turn on?
Substation to Rack: The Power Distribution Chain
Power still has to pass through transformers, switchgear, UPS systems, PDUs, busways, and power shelves before reaching the rack, then through rack-level power conversion to GPUs, CPUs, HBM, NICs, and switches. One missing segment leaves the entire rack waiting. Once electricity enters that equipment, almost every watt eventually becomes heat. Where does that heat go?
The Data Center Thermal Path: Rack to Ambient Air
Heat inside the rack follows two paths. Heat captured by cold plates enters the Technology Cooling System (TCS), passes through manifolds to a CDU, then transfers into the Facility Water System (FWS). Heat not captured by cold plates still enters the rack exhaust through server fans, then moves into rear-door heat exchangers or CRAHs. Both paths ultimately enter facility cooling; cooling towers, dry coolers, or air-cooled chillers then reject the heat to ambient air. One missing segment keeps power capacity from becoming sustained compute. Once power flows, heat leaves, and equipment is installed, why is the facility still not deliverable?
Commissioning: Built Does Not Mean Deliverable
Mechanical Completion and RFS are separated by startup, functional testing, L1-L5 commissioning, Integrated Systems Testing, and operational handover. A successful component startup does not prove that the mission-critical system will survive failure scenarios. Uptime Institute explains why "built" and "deliverable" are different states. The facility is finally deliverable and the GPUs are inside. Why can available compute still be zero?
Then ask when GPUs become compute
RFS delivers only the facility. GPU shipments, server shipments, rack deliveries, and cluster capacity then appear on the same progress sheet. Are they really the same number?
GPU to Rack: Delivering the Compute Rack
GPUs, CPUs, HBM, NICs, and DPUs first become compute trays, which join NVLink switch trays and power shelves inside a rack. Component arrivals do not equal rack deliveries, and rack deliveries do not equal cluster capacity. Once the racks are ready, how do tens of thousands of GPUs become one system?
Superclusters: The Network Ceiling
NVLink handles scale-up; InfiniBand or Ethernet handles scale-out; switch ASICs, optical transceivers, lasers, fiber, connectors, and testing determine whether the fabric passes validation. Once the network works, where do training data, model weights, checkpoints, and KV cache live?
Checkpoint to KV Cache: The Storage Hierarchy
Training data, model weights, checkpoints, local NVMe, parallel file systems, object storage, and KV cache occupy different storage tiers. NAND bits describe capacity; controllers, firmware, reliability, and qualification determine whether enterprise storage can enter service. With compute, networking, and storage installed, who proves the cluster can carry production workloads?
Cluster Delivery: Facility Readiness to Production Handoff
IT deployment, firmware, provisioning, burn-in, fabric validation, cluster acceptance, and healthy handoff all happen after RFS. Installed GPU counts give way to deployment velocity, cluster yield, and healthy capacity before Production Handoff. Once the healthy cluster exists, does one megawatt produce the same compute under Training and Inference?
Compute still has one more leg before revenue
Production Handoff delivers physical capacity. How much billable workload it becomes first depends on what job the cluster receives.
Training vs. Inference: Two Ledgers for the Same MW
Training pursues large-scale synchronous computation. Inference trades off latency, batching, utilization, and geography. The throughput and economics of the same megawatt therefore diverge. When Inference carries Agent workloads, how much computation can one user request unfold into?
The Agent Compute Bill: Token to Task
One user request expands into multiple model invocations plus routing, prefill, decode, retrieval, tool calls, retries, cache behavior, and scheduling. Tokens, requests, tasks, and tasks per megawatt answer different questions. Once the task finishes inside the cluster, how does the result reach the user within its latency SLO?
Inference Delivery Network: Cluster to User
DCI, backbone networks, transit, peering, CDNs, edge infrastructure, and metro inference determine whether the result meets its latency SLO. As internal compute expands, the constraint may migrate outside the data center. By this point, the original 8 GW is no longer one capacity number. Which segment is slowest, and who captures the orders and cash flow?
Test the map with PORTS-Pike's 8 GW
PORTS-Pike 8 GW: Testing the Delivery Chain
Put every PORTS-Pike project back into its delivery stage, expand each gigawatt into power, thermal, compute, network, and storage requirements, then trace the next bottleneck candidate through the Bottleneck Migration Network.
The test accepts only evidence that can be checked: contracts, project milestones, lead times, capacity, qualification, orders, and financial data. Which node is already priced in? Which supplier can turn pricing power into margins and cash flow? What evidence would invalidate the thesis?
Data Center unfolds layer by layer
Follow this map layer by layer, and the Data Center that once looked vague begins to come into focus. A gigawatt is no longer just capacity; it now carries a project state, a system position, and a delivery timeline. Wherever one layer remains undelivered, the Replication Gap stops there.
The next 8 GW, 10 GW, or 100 GW will unfold into site, power, thermal, compute, networking, storage, and workloads. Follow the delivery chain further, and orders, pricing power, and cash flow begin to emerge as well.
The box that once said only Data Center has opened into an entire delivery chain that can be traced.
- Blog Link: https://johnsonlee.io/2026/08/22/ai-data-center-alpha-map.en/
- Copyright Declaration: 著作权归作者所有。商业转载请联系作者获得授权,非商业转载请注明出处。